

Volume 12, Issue 2 (11-2023)
JCHR 2023, 12(2): 217-227 |
Back to browse issues page


Download citation:
BibTeX | RIS | EndNote | Medlars | ProCite | Reference Manager | RefWorks
Send citation to:


BibTeX | RIS | EndNote | Medlars | ProCite | Reference Manager | RefWorks
Send citation to:
Yari F, Agheli L, Sadeghi H, Faraji Dizaji S. Assessment of Factors Associated with Life Expectancy Gap Based on the Preston Curve: A Cross-Sectional Study. JCHR 2023; 12 (2) :217-227
URL: http://jhr.ssu.ac.ir/article-1-971-en.html
URL: http://jhr.ssu.ac.ir/article-1-971-en.html


1- Department of Economic Development and Planning, Faculty of Management and Economics, Tarbiat Modares Univrersity, Tehran, Iran
2- Economic Research Institute, Tarbiat Modares Univrersity, Tehran, Iran ,aghelik@modares.ac.ir
2- Economic Research Institute, Tarbiat Modares Univrersity, Tehran, Iran ,
Full-Text [PDF 811 kb]
(815 Downloads)
| Abstract (HTML) (1519 Views)
Introduction
It can be interpreted that beyond some threshold level of affluence, higher income may no longer imply lower mortality or improved life expectancy and may lead to a stressful and unhealthy lifestyle that could have negative effect on the health status of the population (11, 12).
The Preston curve has also a tendency to shift upwards over time; this reflects improvement in life expectancy independent of national income (13). This perception of the relationship, known as the Preston curve, is broadly cited, and recent research suggests that the relationship still applies.
Some countries stand out of the Preston regular pattern and are located upper or lower than the curve with relatively long distances. The scatter of points around the Preston curve suggests that life expectancy depends not only on the availability of life support resources (14), but also on many other aspects. Increasing incomes imply greater resources for society; however, these resources may not necessarily be spent to improve health outcomes (15).
Spain, Japan, and Greece’s position indicates more than four years positive gap from the curve, while Russia and Saudi Arabia have more than four years of negative gap or deficit in expected life expectancy according to Preston curve of 2018 (Figure 1,and Tables 1 and 2). Since Russia is experiencing lower life expectancy based on its per capita income in comparison with similar income countries, the gaps between the observed and the Preston-expected life expectancy for Russia and its capital Moscow are investigated in a study by breaking down the life expectancy differences by causes of death. When compared with countries with similar level of income, the largest part
of the life expectancy deficit was produced by working-age mortality from external causes for Russia and cardiovascular disease at older ages for Moscow (13).
Determinants of life expectancy and causes of disparity in longevity have been analyzed with the use of different methods, for example, panel data and time series approaches in many studies. Furthermore, wealth inequality, literacy rate, allocation of resources to different budget items (healthcare, military, sanitation, nutrition, education, etc.), political conditions, and mortality due to diseases, have been taken into consideration in studies as other factors affecting life expectancy.
The question that arises is: “Why do some countries experience life expectancy deviations from the respective regression line at a given per capita income level?” The present study aims to identify the causes of the existence of these positive (excess) or negative (deficit) life expectancy gaps from the curve. In other words, the study aims to investigate new evidences on factors that enable countries to reach good health even with few resources or relatively low incomes. In this regard, after reproducing the Preston curve with the use of data of 182 countries worldwide, countries with more than four years of deviation in two groups of countries with positive deviation (group 1) and negative deviation (group 2) were studied, and their characteristics were compared through statistical tests. Understanding and analyzing the roots of health outcome disparities among countries are beneficial to catch up with desired socioeconomic consequences and adopt appropriate health planning programs.
Methods
Preston’s (1975) explanation of the changing relationship between income and health is considered a starting point for any discussion of global health inequalities (16). In his study, scatter diagrams of the cross-sectional relation between national per capita income and life expectancy were developed to shed light on a number of questions about the effect of economic level on national mortality trends and differentials.
In this study, using cross-sectional data of variables life expectancy at birth (years) and per capita GDP by purchasing power parity (PPP) of 182 countries worldwide, first, the well-known Preston curve was reproduced and updated in the year 2018.
A logarithmic regression model was conducted where life expectancy is the independent variable and per capita GDP is the explanatory variable.
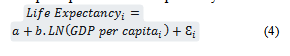
In which index i indicates the country, εi is the random error specific to that country, and the parameters to be estimated are a and b.
The model is estimated as follows:
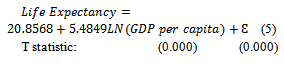
The model fit was assessed by standard statistics of R2 and F-test. The R-Squared of 0.7160 indicated that approximately 71% of the variation in life expectancy can be explained by the per capita GDP, with high statistical significance
(p < 0.0001). Unaccounted factors explained the remaining 29% of the variation.
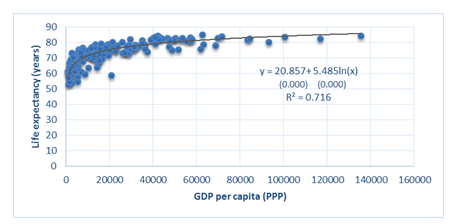
Figure 1 reproduces the nonlinear concave Preston curve. Life expectancy at birth is on the vertical axis, and per capita GDP is on the horizontal axis.
References
1. Balabanova D, Mills A, Conteh L, et al. Good health at low cost 25 years on: lessons for the future of health systems strengthening. The Lancet. 2013; 381(9883): 2118-33.
2. Mackenbach JP, Valverde JR, Bopp M, et al. Determinants of inequalities in life expectancy: an international comparative study of eight risk factors. The Lancet Public Health. 2019; 4(10): e529-e37.
3. Miladinov G. Socioeconomic development and life expectancy relationship: evidence from the EU accession candidate countries. Genus. 2020; 76(1): 2.
4. Mackenbach JP, Looman CW. Life expectancy and national income in Europe, 1900-2008: an update of Preston’s analysis. International journal of epidemiology. 2013; 42(4): 1100-10.
5. Jetter M, Laudage S, Stadelmann D. The intimate link between income levels and life expectancy: global evidence from 213 years. Social Science Quarterly. 2019; 100(4): 1387-403.
6. Clark R. World health inequality: Convergence, divergence, and development. Social science & medicine. 2011; 72(4): 617-24.
7. Preston SH. The changing relation between mortality and level of economic development. Population studies. 1975; 29(2): 231-48.
8. Preston SH. The changing relation between mortality and level of economic development. International journal of epidemiology. 2007; 36(3): 484-90.
9. Bloom DE, Canning D. Commentary: The Preston Curve 30 years on: still sparking fires. International Journal of Epidemiology. 2007; 36(3): 498-9.
10. Garcia J, Narvil J, Oh S. Modern day evaluation of the Preston curve: the relationship between life expectancy and income. 2016.
11. Benos N, Karkalakos S, Zotou S. Spatial and economic patterns in life expectancy among US States. Applied Economics. 2019; 51(54): 5856-69.
12. Yari F, Agheli L, Sadeghi H, Dizaji SF. The socioeconomic and political determinants of life expectancy in selected countries of the world. Social Determinants of Health. 2022; 8: 1-9. [Persian]
13. Shkolnikov VM, Andreev EM, Tursun-Zade R, et al. Patterns in the relationship between life expectancy and gross domestic product in Russia in 2005–15: a cross-sectional analysis. The Lancet Public Health. 2019; 4(4): e181-e8.
14. Luo W, Xie Y. Economic growth, income inequality and life expectancy in China. Social Science & Medicine. 2020; 256: 113046.
15. Lutz W, Kebede E. Education and health: redrawing the Preston curve. Population and development review. 2018; 44(2): 343.
16. Fadnes LT, Økland J-M, Haaland ØA, et al. Estimating impact of food choices on life expectancy: A modeling study. PLoS Medicine. 2022; 19(2): e1003889.
17. Inam B, Murat D. The correlation between income inequality and population health: An empirical study. Redefining global economic thinking for the welfare of society: IGI Global; 2022: 94-113.
18. Hill TD, Jorgenson A. Bring out your dead!: A study of income inequality and life expectancy in the United States, 2000–2010. Health & place. 2018; 49: 1-6.
19. WHO. Water sanitation and hygiene strategy. World Health Organization; 2019. Available at: URL: https://www.who.int/teams/environment-climate-change-and-health/water-sanitation-and-health/about.
20. Lu Z, Bandara JS, Paramati SR. Impact of sanitation, safe drinking water and health expenditure on infant mortality rate in developing economies. Australian Economic Papers. 2020; 59(1): 13-33.
21. Freeman T, Gesesew HA, Bambra C, et al. Why do some countries do better or worse in life expectancy relative to income? An analysis of Brazil, Ethiopia, and the United States of America. International journal for equity in health. 2020; 19(1): 1-19.
22. Irwin BR, Hoxha K, Grépin KA. Conceptualising the effect of access to electricity on health in low-and middle-income countries: A systematic review. Global Public Health. 2020; 15(3): 452-73.
23. Gohlke JM, Thomas R, Woodward A, et al. Estimating the global public health implications of electricity and coal consumption. Environmental health perspectives. 2011; 119(6): 821-6.
24. Rahman MM, Alam K. The role of access to electricity, female education, and public health expenditure on female health outcomes: evidence from SAARC-ASEAN countries. BMC Women's Health. 2021; 21(1): 1-12. [Persian]
25. Juginović A, Vuković M, Aranza I, et al. Health impacts of air pollution exposure from 1990 to 2019 in 43 European countries. Scientific Reports. 2021; 11(1): 22516.
26. Lelieveld J, Pozzer A, Pöschl U, et al. Loss of life expectancy from air pollution compared to other risk factors: a worldwide perspective. Cardiovascular research. 2020; 116(11): 1910-7.
27. Amuka JI, Asogwa FO, Ugwuanyi RO, et al. Climate change and life expectancy in a developing country: evidence from greenhouse gas (CO2) emission in Nigeria. International Journal of Economics and Financial Issues. 2018; 8(4): 113.
28. Obrizan M, Wehby GL. Health expenditures and global inequalities in longevity. World Development. 2018; 101: 28-36.
29. Raghupathi V, Raghupathi W. The influence of education on health: an empirical assessment of OECD countries for the period 1995–2015. Archives of Public Health. 2020; 78(1): 1-18.
30. Luy M, Zannella M, Wegner-Siegmundt C, Minagawa Y, Lutz W, et al. The impact of increasing education levels on rising life expectancy: a decomposition analysis for Italy, Denmark, and the USA. Genus. 2019; 75: 1-21.
31. Chandran A, Kahn G, Sousa T, Pechansky F, Bishai DM, et al. Impact of road traffic deaths on expected years of life lost and reduction in life expectancy in Brazil. Demography. 2013; 50(1): 229-36.
32. James SL, Lucchesi LR, Bisignano C, Castle CD, Dingels ZV, Fox JT, Hamilton EB, Liu Z, McCracken D, Nixon MR, Sylte DO. Morbidity and mortality from road injuries: results from the Global Burden of Disease Study 2017. Injury prevention. 2020; 26(Suppl 2): i46-56.
33. Eun SJ. Trends in mortality from road traffic injuries in South Korea, 1983–2017: Joinpoint regression and age-period-cohort analyses. Accident Analysis & Prevention. 2020; 134: 105325.
34. Fei FR, Zhong JM, Yu M, Gong WW, Wang M, et al. Impact of injury-related mortality on life expectancy in Zhejiang, China based on death and population surveillance data. BMC public health. 2018; 18(1): 1-7.
35. Lozano R, Fullman N, Mumford JE, Knight M, Barthelemy CM, et al. Measuring universal health coverage based on an index of effective coverage of health services in 204 countries and territories, 1990–2019: a systematic analysis for the Global Burden of Disease Study 2019. The Lancet. 2020; 396(10258): 1250-84.
36. Davis K, Huang AT. Learning from Taiwan: experience with universal health insurance. Annals of internal medicine. 2008; 148(4): 313-4.
37. Ranabhat CL, Atkinson J, Park MB, Kim CB, Jakovljevic M. The influence of universal health coverage on life expectancy at birth (LEAB) and healthy life expectancy (HALE): a multi-country cross-sectional study. Frontiers in pharmacology. 2018; 9: 960.
Full-Text: (587 Views)
| Assessment of Factors Associated with Life Expectancy Gap Based on the Preston Curve: A Cross-Sectional Study |

- Department of Economic Development and Planning, Faculty of Management and Economics, Tarbiat Modares Univrersity, Tehran, Iran
- Economic Research Institute, Tarbiat Modares Univrersity, Tehran, Iran
| ARTICLE INFO | ABSTRACT | |
| Original Article Received: 21 Feb 2023 Accepted: 15 May 2023 |
Background: Some countries experience lower or higher life expectancy than what is predicted based on their income. This study examines why life expectancy deviation is experienced with the aim of exploring which factors and conditions contribute to better health outcome (life expectancy) at low cost.
Methods: In this study at the first stage, the well-known Preston curve is reproduced and updated using the cross-sectional data of variables of life expectancy at birth (years) and per capita gross domestic product (GDP) by purchasing power parity (PPP) of 182 countries around the World in 2018 based on the latest available data. After estimating the deviation of each countries life expectancy from the curve, the characteristics of countries with more than four years of positive (group 1) and negative (group 2) gaps from the curve were compared by applying the mean comparison test of two independent groups (t-test).
Results: The identified drivers of gains or losses in longevity relative to income included using at least basic sanitation (P = 0.012) and drinking water services (P = 0.045), Universal Health Coverage (UHC) (P = 0.012), access to electricity (P = 0.004), CO2 emissions (P = 0.037), inequality in income (P = 0.003), health expenditure per capita (P = 0.000), non-communicable (P = 0.000) and communicable diseases and maternal, prenatal, and nutrition conditions (P = 0.000), literacy rate (P = 0.057), and road injuries (P = 0.001). Conclusion: Better health outcome in countries and regions with relatively low income or few resources can be achieved that would be critical for global improvement in population health. However, it needs to take effective measures and is of great importance for policy-making. Keywords: Life Expectancy, Income, Population Health |
|
 |
||
Corresponding Author: Lotfali Agheli aghelik@modares.ac.ir |
Introduction
At similar level of income, some countries achieve better health outcomes than do others. The phrase “good health at low cost” expresses that health improvements can also be achieved in countries with relatively low income levels. The national and regional experiences indicate that progress in health is possible even with limited resources (1). In this regard, life expectancy at birth as an important measure of population health status has been investigated. The disparity in life expectancy among countries has remarkable implications for public health systems and has attracted researchers’ attention for decades. This disparity is driven by many factors. Socioeconomic differences are known as a considerable source of inequalities in health (2). Changes in the socioeconomic development have a significant influence on the expected changes in the life expectancy at birth as a criterion for past, present, and future variations of mortality levels (3). Economic well-being has been placed at the center of determinants of population health theories (4). Income disparity is an essential factor for explaining life expectancy trends and is of great importance for policymaking. There are several pieces of research on the positive impact of per capita gross domestic product (GDP) on longevity (3-5). According to a study, per capita GDP significantly raises life expectancy and reduces infant mortality; however, at higher levels of development, the positive effect of per capita GDP on life expectancy weakens (6).
In explaining the relationship between health and income, Preston (7, 8) investigated the cross-sectional relationship between life expectancy at birth of countries worldwide and their per capita GDP as an important economic marker. The Preston curve has long served as the basis of both global public health policy and academic discussion of public health (9, 10). The so-called Preston curve indicates a dramatic increase in life expectancy in countries with low levels of per capita income and a slower growth in life expectancy in countries with higher incomes. The implication of the curve is that, the income elasticity of life expectancy is high in low income countries, while it becomes lower in high income countries. The income elasticity of life expectancy shows the relative change in life expectancy as a result of one percent change in per capita income. The income elasticity of life expectancy can be computed as follows:
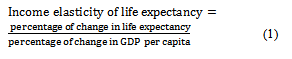
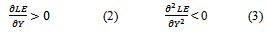
In fact the relationship between life expectancy and income is nonlinear. The functional form is concave and has a slope at every point that is decreasing. The deviations are as follows (LE denotes life expectancy and Y denotes per capita income):
In explaining the relationship between health and income, Preston (7, 8) investigated the cross-sectional relationship between life expectancy at birth of countries worldwide and their per capita GDP as an important economic marker. The Preston curve has long served as the basis of both global public health policy and academic discussion of public health (9, 10). The so-called Preston curve indicates a dramatic increase in life expectancy in countries with low levels of per capita income and a slower growth in life expectancy in countries with higher incomes. The implication of the curve is that, the income elasticity of life expectancy is high in low income countries, while it becomes lower in high income countries. The income elasticity of life expectancy shows the relative change in life expectancy as a result of one percent change in per capita income. The income elasticity of life expectancy can be computed as follows:
In fact the relationship between life expectancy and income is nonlinear. The functional form is concave and has a slope at every point that is decreasing. The deviations are as follows (LE denotes life expectancy and Y denotes per capita income):
It can be interpreted that beyond some threshold level of affluence, higher income may no longer imply lower mortality or improved life expectancy and may lead to a stressful and unhealthy lifestyle that could have negative effect on the health status of the population (11, 12).
The Preston curve has also a tendency to shift upwards over time; this reflects improvement in life expectancy independent of national income (13). This perception of the relationship, known as the Preston curve, is broadly cited, and recent research suggests that the relationship still applies.
Some countries stand out of the Preston regular pattern and are located upper or lower than the curve with relatively long distances. The scatter of points around the Preston curve suggests that life expectancy depends not only on the availability of life support resources (14), but also on many other aspects. Increasing incomes imply greater resources for society; however, these resources may not necessarily be spent to improve health outcomes (15).
Spain, Japan, and Greece’s position indicates more than four years positive gap from the curve, while Russia and Saudi Arabia have more than four years of negative gap or deficit in expected life expectancy according to Preston curve of 2018 (Figure 1,and Tables 1 and 2). Since Russia is experiencing lower life expectancy based on its per capita income in comparison with similar income countries, the gaps between the observed and the Preston-expected life expectancy for Russia and its capital Moscow are investigated in a study by breaking down the life expectancy differences by causes of death. When compared with countries with similar level of income, the largest part
of the life expectancy deficit was produced by working-age mortality from external causes for Russia and cardiovascular disease at older ages for Moscow (13).
Determinants of life expectancy and causes of disparity in longevity have been analyzed with the use of different methods, for example, panel data and time series approaches in many studies. Furthermore, wealth inequality, literacy rate, allocation of resources to different budget items (healthcare, military, sanitation, nutrition, education, etc.), political conditions, and mortality due to diseases, have been taken into consideration in studies as other factors affecting life expectancy.
The question that arises is: “Why do some countries experience life expectancy deviations from the respective regression line at a given per capita income level?” The present study aims to identify the causes of the existence of these positive (excess) or negative (deficit) life expectancy gaps from the curve. In other words, the study aims to investigate new evidences on factors that enable countries to reach good health even with few resources or relatively low incomes. In this regard, after reproducing the Preston curve with the use of data of 182 countries worldwide, countries with more than four years of deviation in two groups of countries with positive deviation (group 1) and negative deviation (group 2) were studied, and their characteristics were compared through statistical tests. Understanding and analyzing the roots of health outcome disparities among countries are beneficial to catch up with desired socioeconomic consequences and adopt appropriate health planning programs.
Methods
Preston’s (1975) explanation of the changing relationship between income and health is considered a starting point for any discussion of global health inequalities (16). In his study, scatter diagrams of the cross-sectional relation between national per capita income and life expectancy were developed to shed light on a number of questions about the effect of economic level on national mortality trends and differentials.
In this study, using cross-sectional data of variables life expectancy at birth (years) and per capita GDP by purchasing power parity (PPP) of 182 countries worldwide, first, the well-known Preston curve was reproduced and updated in the year 2018.
A logarithmic regression model was conducted where life expectancy is the independent variable and per capita GDP is the explanatory variable.
In which index i indicates the country, εi is the random error specific to that country, and the parameters to be estimated are a and b.
The model is estimated as follows:
The model fit was assessed by standard statistics of R2 and F-test. The R-Squared of 0.7160 indicated that approximately 71% of the variation in life expectancy can be explained by the per capita GDP, with high statistical significance
(p < 0.0001). Unaccounted factors explained the remaining 29% of the variation.
Figure 1 reproduces the nonlinear concave Preston curve. Life expectancy at birth is on the vertical axis, and per capita GDP is on the horizontal axis.
Figure 1. Regenerated Preston Curve (2018)
Subsequently, the deviations of each of 182 countries from the Preston curve were calculated as the difference between the actual values of the life expectancy in 2018 and GDP-based life expectancy estimated based on the logarithmic model. It is clear that if the actual value of life expectancy of a country is higher/lower than what is expected based on the Preston curve, this country will experience a positive/negative gap in its life expectancy.
Among all, 53 countries were identified for analysis, 26 of them with more than four years of positive gap were named group 1, and 27 of them that had more than four years of negative gap were named group 2. The lists of these countries are available in Tables 1 and 2. The amount of deviation of more than four years is considered remarkable.
To determine the factors affecting life expectancy, except for per capita GDP, the characteristics of the two country groups were investigated with the use of statistical tests and comparisons. In this regard, based on the relevant literature, the factors introduced in Table 3 were selected for investigation.
The data were analyzed using the mean comparison test of two independent groups (t-test) and Stata software. A t-test is a statistical test used to compare the means of two groups. Confidence interval (CI) of 95% and a two-sided P < 0.05 were considered to be statistically significant.
According to the results of Shapiro-Wilk test, the distribution of all variables was normal, so t-tests were run to evaluate the significance of the difference between the two groups in terms of contextual variables (Table 3). If the P-value was less than 0.05 (typically ≤ 0.05), the difference between the groups would be statistically significant.
The data for the variables in this study were extracted from the websites of World Bank, Our World in Data, and Economist Intelligence Unit.
Results
Table 1 show the actual and GDP based life expectancy at birth (expected life expectancy) and their difference (gap), and GDP per capita for the countries of group 1. The per capita income varied from 1630$ to 42202$ among the countries of this group. The lowest and highest values were attributed to Madagascar and Japan, respectively. The top three countries of Solomon Islands, Honduras, and Morocco had considerable positive difference in actual and expected life expectancy, so they were placed far from the curve.
Table 1. Characteristics of countries in group 1 (2018)
| Country | Actual life expectancy (years) | GDP based life expectancy (years) | Gap (years) |
GDP per capita, (PPP) |
| Solomon Islands | 72.83 | 64.31 | +8.51 | 2762.41$ |
| Honduras | 75.08 | 68.40 | +6.68 | 5816.74$ |
| Morocco | 76.45 | 69.88 | +6.56 | 7625.73$ |
| Nicaragua | 74.27 | 68.45 | +5.82 | 5867.24$ |
| Rwanda | 68.7 | 62.91 | +5.78 | 2138.9$ |
| Albania | 78.45 | 73.01 | +5.44 | 13483.01$ |
| Vietnam | 75.31 | 69.99 | +5.32 | 7768.08$ |
| Bangladesh | 72.32 | 67.05 | +5.26 | 4547.48$ |
| Tajikistan | 70.87 | 65.61 | +5.26 | 3497.32$ |
| Madagascar | 66.68 | 61.42 | +5.25 | 1630.18$ |
| Vanuatu | 70.32 | 65.07 | +5.25 | 3167.73$ |
| Barbados | 79.08 | 73.97 | +5.10 | 16051.26$ |
| Japan | 84.21 | 79.27 | +4.93 | 42202.4$ |
| West Bank and Gaza | 73.89 | 68.98 | +4.90 | 6469.90$ |
| Lebanon | 78.87 | 73.97 | +4.90 | 16054.36$ |
| Belize | 74.49 | 69.75 | +4.74 | 7436.04$ |
| Kiribati | 68.11 | 63.41 | +4.70 | 2341.19$ |
| Costa-Rica | 80.09 | 75.52 | +4.56 | 21319.04$ |
| Ecuador | 76.80 | 72.30 | +4.49 | 11839.34$ |
| Greece | 81.78 | 77.33 | +4.45 | 29617.55$ |
| Spain | 83.43 | 79.07 | +4.35 | 40696.39$ |
| Algeria | 76.69 | 72.33 | +4.35 | 11909.93$ |
| Nepal | 70.47 | 66.16 | +4.31 | 3864.32$ |
| Tunisia | 76.50 | 72.21 | +4.28 | 11658.73$ |
| Timor-Leste | 69.26 | 65.07 | +4.18 | 3168.41$ |
| Samoa | 73.18 | 69.04 | +4.14 | 6537.87$ |
Table 2 shows the actual and GDP based life expectancy at birth (expected life expectancy) and their difference (gap), and GDP per capita for the countries of group 2. The per capita income varied from 955$ to 68576$ among countries of this group, while the lowest and highest values were attributed to Central African Republic and United Arab Emirates. Moreover, five countries of Equatorial Guinea, Nigeria, Eswatini, Lesotho, and Côte d'Ivoire re were recognized with more than 10 years negative gaps which was worth considering.
The results of the t-tests are presented in
Table 3.
The results of the t-tests are presented in
Table 3.
Table 2. Characteristics of countries in group 2 (2018)
| Country | Actual life expectancy (years) | Expected life expectancy (years) | Gap (years) | GDP per capita, (PPP) |
| Equatorial Guinea | 58.40 | 75.41 | -17.01 | 20875.48$ |
| Nigeria | 54.33 | 67.87 | -13.53 | 5278.84$ |
| Eswatini | 59.40 | 70.62 | -11.22 | 8725.16$ |
| Lesotho | 53.70 | 64.14 | -10.44 | 2677.43$ |
| Côte d'Ivoire | 57.42 | 67.74 | -10.31 | 5154.33$ |
| South Africa | 63.85 | 73.30 | -9.44 | 14209.09$ |
| Angola | 60.78 | 69.49 | -8.71 | 7099.97$ |
| Namibia | 63.37 | 71.55 | -8.18 | 10329.66$ |
| Gabon | 66.18 | 73.63 | -7.44 | 15097.69$ |
| Chad | 53.97 | 61.37 | -7.39 | 1614.16$ |
| Sierra Leone | 54.30 | 61.63 | -7.32 | 1694.32$ |
| Cameron | 58.92 | 66.06 | -7.14 | 3800.97$ |
| Fiji | 67.34 | 73.29 | -5.94 | 14178.56$ |
| Central African Republic | 52.80 | 58.49 | -5.69 | 955.51$ |
| Brunei Darussalam | 75.72 | 81.36 | -5.64 | 61839.12$ |
| Turkmenistan | 68.07 | 73.67 | -5.59 | 15201.78$ |
| Zimbabwe | 61.19 | 66.37 | -5.17 | 4017.22$ |
| Saudi Arabia | 74.99 | 80.06 | -5.06 | 48735.46$ |
| Kuwait | 75.39 | 80.38 | -4.98 | 51690.57$ |
| Botswana | 69.27 | 74.15 | -4.88 | 16611.9$ |
| Bahamas, The | 73.75 | 78.61 | -4.86 | 37416.97$ |
| Russian Federation | 72.66 | 77.18 | -4.51 | 28821.25$ |
| Mali | 58.89 | 63.40 | -4.51 | 2338.53$ |
| Guinea-Bissau | 58.00 | 62.40 | -4.39 | 1947.59$ |
| Ghana | 63.78 | 68.03 | -4.25 | 5442.87$ |
| Seychelles | 72.84 | 77.06 | -4.21 | 28190.48$ |
| United Arab Emirates | 77.81 | 81.93 | -4.12 | 68576.12$ |
Table 3. Comparison of the two groups of countries according to the underlying indicators
| Variable | Group | Obs. | Mean | Std. deviation |
P-value |
| Voice and accountability 1 | Group 1 Group 2 |
22 26 |
0.4765 0.3778 |
0.1966 0.1824 |
0.0780 |
| Gini index | Group 1 Group 2 |
24 22 |
37.815 45.085 |
6.7836 8.9702 |
0.0032* |
| Vegetable consumption per person (kg) 2 | Group 1 Group 2 |
25 24 |
95.52 59.71 |
81.4082 45.3680 |
0.0648 |
| People using at least basic sanitation services (% of the population) | Group 1 Group 2 |
26 25 |
78.96 58.30 |
23.9480 32.1718 |
0.0120* |
| People using at least basic drinking water services (% of the population) | Group 1 Group 2 |
26 26 |
88.89 79.90 |
12.8182 18.3363 |
0.0458* |
| Access to electricity (% of the population) | Group 1 Group 2 |
26 27 |
89.54 69.11 |
20.085 29.0640 |
0.0046* |
| CO2 emissions (kt) | Group 1 Group 2 |
25 27 |
2.1982 5.14364 |
2.1472 6.6745 |
0.0371* |
| Health expenditure per capita (PPP) | Group 1 Group 2 |
25 27 |
875.12 82.70 |
1129.577 17.3267 |
0.0006* |
| Out of pocket expenditure (% of current health expenditure) | Group 1 Group 2 |
25 27 |
31.69 33.69 |
19.7847 24.7266 |
0.7504 |
| Cause of death, by communicable diseases and maternal, prenatal, and nutrition conditions (% of total) | Group 1 Group 2 |
25 27 |
16.27 38.04 |
11.1290 21.4793 |
0.0000* |
| Cause of death, by non-communicable diseases (% of total) | Group 1 Group 2 |
25 27 |
75.40 51.75 |
12.3814 21.0841 |
0.0000* |
| Literacy rate (% of people ages 15 and above) | Group 1 Group 2 |
25 26 |
88.29 78.74 |
10.7255 22.2821 |
0.0574* |
| Urban population (% of the total population) | Group 1 Group 2 |
26 27 |
51.59 58.25 |
23.6996 20.6898 |
0.2807 |
| PM2.5 air pollution, mean annual exposure (microgram per cubic meter) | Group 1 Group 2 |
26 27 |
27.33 35.95 |
19.6147 21.2857 |
0.1320 |
| Alcohol consumption (liters per capita) | Group 1 Group 2 |
25 27 |
4.468 5.455 |
3.5296 4.2809 |
0.3712 |
| Health expenditure (% of GDP) | Group 1 Group 2 |
25 27 |
6.62 5.56 |
2.1902 2.5451 |
0.1161 |
| Deaths from road injuries (per 100,000 individuals) | Group 1 Group 2 |
25 27 |
16.59 27.75 |
8.2272 15.1105 |
0.0018* |
| UHC service coverage index | Group 1 Group 2 |
25 27 |
64.84 54.74 |
12.95 15.07 |
0.0128* |
* Statistically significant
1 Voice and accountability indicator is average of 5 sub-indicators: Democracy index, Vested interests, Accountability of public officials, Human rights, Freedom of association.
2 The data for the year 2018 was not available for all variables. Data on vegetable supply (as a proxy of vegetable consumption) is for 2017; data on cause of death is for 2019; data on PM2.5 air pollution is for 2017; data on UHC is for 2019.
Discussion
As can be seen in Table 3, there was a significant difference between the two groups of countries in the variables of the Gini index, people using at least basic sanitation and drinking water services, access to electricity, CO2 emissions, health expenditure per capita, cause of death by non-communicable and communicable diseases and maternal, prenatal, and nutrition conditions, literacy rate, deaths from road injuries, and Universal Health Coverage (UHC). It was identified that these factors had an impact on the gains or losses in life expectancy relative to per capita GDP.
The relevant variables are discussed below.
Income inequality: The income inequality experienced by the individuals or throughout life can adversely affect several populations' health outcomes, especially life expectancy at birth (17). Gini index is an indicator of income equality in a country that ranges between 0-1. A Gini index of zero means an equal distribution of income, whereas a number closer to 1 indicates greater income inequality. In the present study, this index was significantly higher in the second group of countries that had a negative life expectancy gap, according to Preston curve 2018. Likewise, a study in China found that the sharply increasing income inequality in China has caused life loss in China's population, about 0.4 years for women and 0.6 years for men (14). Also, a study in the United States has revealed that state-level income inequality is inversely associated with female and male life expectancy (18).
Sanitation and drinking water services: Safe water and adequate sanitation are vital to individual health, livelihood and well-being. Yet, more than one out of four people in the world, around 2 billion people, do not have access to basic sanitation services (19). Provision of safe water supply and sanitation facilities can significantly result in mortality decline and health improvement. The results of this study indicated that access to basic sanitation and drinking water services in group 1 were significantly higher than group 2. Consistently, a study on 84 developing economies has suggested that an increase in access to improved water and sanitation facilities reduces the infant mortality rate (20). Also, improving access to safe water has been identified as a cause of three years extra life expectancy relative to income in Ethiopia (21).
Access to electricity: Access to electricity has been correlated with a number of health outcomes including lower infant and maternal mortality. Therefore, expanding access to electricity may also be an important driver of improved global health outcomes (22). This is evident from the results of this study that electricity consumption was significantly higher in group 1. Consistently, the relationship between electricity use and health outcomes was assessed in a study on 41 countries. The time-series model indicated that increased electricity consumption was associated with reduced infant mortality for countries that started with relatively high infant mortality and low life expectancy (23). Also, a study indicated that access to electricity has a significantly positive effect on female life expectancy at birth, and a negative effect on the female adult mortality in SAARC-ASEAN countries (24).
Air pollution: Air pollution is one of the most significant overall risk factors for human health and represents a major health and economic burden (25). Global Burden of Disease (GBD) studies have assessed major health impacts and excess mortality rates from ambient (outdoor) air pollution, building on a growing database from epidemiological cohort studies (26). The results of this study suggested no significant difference in the PM2.5 annual exposure between the two groups of countries, while the difference in CO2 emissions was significant and group 2 experienced higher emissions. The results are consistent with empirical findings of a study examining the effect of climate change on life expectancy, with particular reference to CO2 in Nigeria that suggests a positive relationship between CO2 emissions and life expectancy (27).
Health expenditure: It is often tried to improve health status of populations through effective healthcare funding. In many empirical studies, there appears to be a significant relationship between life expectancy and health expenditure. This study suggested higher health expenditure per capita in group 1 and a significant difference between the two groups. However, the difference between health expenditures (% of GDP) was not significant. In accordance with the findings of this study, based on a previous study, increasing health spending in countries with low life expectancy has a substantial effect on life expectancy and significantly lessens global inequalities in longevity (28).
Communicable and non-communicable diseases: Communicable and non-communicable diseases negatively affect life expectancy and other health indicators. Based on the results of current study, deaths caused by communicable diseases and maternal, prenatal, and nutrition conditions were significantly higher in group 2, while deaths by non-communicable diseases were significantly higher in group 1.
Literacy rate: Several studies have evaluated the effect of education on life expectancy, suggesting that education policies can also be considered indirect health policies. A clear understanding of the health benefits of education can be the key to reducing health disparities and improving the well-being of future populations (29). In the current study, a significant difference was reported between two groups of countries in literacy rate. Consistently, the strong associations between education and overall population health i.e., life expectancy, have been found in Italy, Denmark, and the USA (30).
Road injury: Injuries are a substantial cause of morbidity and mortality in the developed and
developing world, with motor vehicle crashes playing a substantial role (31). Road accident injury is a leading cause of death and a major contributor to premature mortality worldwide (32). Globally, 1243068 people died from road injuries in 2017 out of 54 192 330 new cases of road injuries (33). The results of this study suggested that deaths from road injuries were significantly higher in group 2. Consistently, a study in China indicated that injury deaths had a major impact on life expectancy in Zhejiang, and the road traffic injuries had the greatest impact on life expectancy (34). Based on a study in Brazil, road traffic deaths reduced the at-birth life expectancy by 0.8 years for males and by 0.2 years for females (31).
Universal Health Coverage: UHC is considered as a crucial avenue through which improved health for all can be attained by ensuring all people can receive quality health services they need, without experiencing financial hardship (35). The role of UHC, which ensures broad population access to promotive, preventive, curative, and rehabilitative health services, is receiving growing attention and is expected to affect life expectancy as a comprehensive health policy. Based on the results of this study, UHC is found to be significantly higher in countries of group 1. In accordance with the resent study findings, a study reported that life expectancy and other health outcomes significantly increased in Taiwan after the adoption of UHC (36). Moreover, a study on 193 United Nations member countries reported that UHC has the greatest influence on life expectancy at birth and healthy life expectancy among other predictors (37).
Conclusion
This study aimed to highlight the factors affecting population life expectancy relative to per capita GDP with the use of cross-sectional data of 182 World countries and t-test analysis. The analysis investigated different driving factors from health system and out of health system to discover why some countries experience deficit or excess in life expectancy based on their income. The identified determinants included using at least basic sanitation and drinking water services, access to electricity, health expenditure per capita, deaths by communicable and non-communicable diseases, literacy rate, income inequality, CO2 emissions, deaths from road injuries, and UHC. This is of great importance at the national and international levels to achieve the highest possible level of population health with relatively low incomes or few resources, which needs to take effective measures and is very important for policy making.
Acknowledgement
The deputy for Research Affairs of the University supported this research financially. The Ethics Committee of the Tarbiat Modares University approved the study.
Conflict of interests
The authors declare no conflict of interest.
Funding
The Deputy for Research Affairs of the University supported this research financially.
Ethical Considerations
This study was approved by the Ethics Committee of University
Code of Ethics
IR.MODARES.REC.1399.147
Authors’ contributions
Data collection and drafting of the manuscript, F. Y. All authors contributed to the intellectual content, manuscript editing and read and approved the final manuscript.
Open Access Policy
JCHR does not charge readers and their institution for access to its papers. Full text download of all new and archived papers are free of charge.
References
1. Balabanova D, Mills A, Conteh L, et al. Good health at low cost 25 years on: lessons for the future of health systems strengthening. The Lancet. 2013; 381(9883): 2118-33.
2. Mackenbach JP, Valverde JR, Bopp M, et al. Determinants of inequalities in life expectancy: an international comparative study of eight risk factors. The Lancet Public Health. 2019; 4(10): e529-e37.
3. Miladinov G. Socioeconomic development and life expectancy relationship: evidence from the EU accession candidate countries. Genus. 2020; 76(1): 2.
4. Mackenbach JP, Looman CW. Life expectancy and national income in Europe, 1900-2008: an update of Preston’s analysis. International journal of epidemiology. 2013; 42(4): 1100-10.
5. Jetter M, Laudage S, Stadelmann D. The intimate link between income levels and life expectancy: global evidence from 213 years. Social Science Quarterly. 2019; 100(4): 1387-403.
6. Clark R. World health inequality: Convergence, divergence, and development. Social science & medicine. 2011; 72(4): 617-24.
7. Preston SH. The changing relation between mortality and level of economic development. Population studies. 1975; 29(2): 231-48.
8. Preston SH. The changing relation between mortality and level of economic development. International journal of epidemiology. 2007; 36(3): 484-90.
9. Bloom DE, Canning D. Commentary: The Preston Curve 30 years on: still sparking fires. International Journal of Epidemiology. 2007; 36(3): 498-9.
10. Garcia J, Narvil J, Oh S. Modern day evaluation of the Preston curve: the relationship between life expectancy and income. 2016.
11. Benos N, Karkalakos S, Zotou S. Spatial and economic patterns in life expectancy among US States. Applied Economics. 2019; 51(54): 5856-69.
12. Yari F, Agheli L, Sadeghi H, Dizaji SF. The socioeconomic and political determinants of life expectancy in selected countries of the world. Social Determinants of Health. 2022; 8: 1-9. [Persian]
13. Shkolnikov VM, Andreev EM, Tursun-Zade R, et al. Patterns in the relationship between life expectancy and gross domestic product in Russia in 2005–15: a cross-sectional analysis. The Lancet Public Health. 2019; 4(4): e181-e8.
14. Luo W, Xie Y. Economic growth, income inequality and life expectancy in China. Social Science & Medicine. 2020; 256: 113046.
15. Lutz W, Kebede E. Education and health: redrawing the Preston curve. Population and development review. 2018; 44(2): 343.
16. Fadnes LT, Økland J-M, Haaland ØA, et al. Estimating impact of food choices on life expectancy: A modeling study. PLoS Medicine. 2022; 19(2): e1003889.
17. Inam B, Murat D. The correlation between income inequality and population health: An empirical study. Redefining global economic thinking for the welfare of society: IGI Global; 2022: 94-113.
18. Hill TD, Jorgenson A. Bring out your dead!: A study of income inequality and life expectancy in the United States, 2000–2010. Health & place. 2018; 49: 1-6.
19. WHO. Water sanitation and hygiene strategy. World Health Organization; 2019. Available at: URL: https://www.who.int/teams/environment-climate-change-and-health/water-sanitation-and-health/about.
20. Lu Z, Bandara JS, Paramati SR. Impact of sanitation, safe drinking water and health expenditure on infant mortality rate in developing economies. Australian Economic Papers. 2020; 59(1): 13-33.
21. Freeman T, Gesesew HA, Bambra C, et al. Why do some countries do better or worse in life expectancy relative to income? An analysis of Brazil, Ethiopia, and the United States of America. International journal for equity in health. 2020; 19(1): 1-19.
22. Irwin BR, Hoxha K, Grépin KA. Conceptualising the effect of access to electricity on health in low-and middle-income countries: A systematic review. Global Public Health. 2020; 15(3): 452-73.
23. Gohlke JM, Thomas R, Woodward A, et al. Estimating the global public health implications of electricity and coal consumption. Environmental health perspectives. 2011; 119(6): 821-6.
24. Rahman MM, Alam K. The role of access to electricity, female education, and public health expenditure on female health outcomes: evidence from SAARC-ASEAN countries. BMC Women's Health. 2021; 21(1): 1-12. [Persian]
25. Juginović A, Vuković M, Aranza I, et al. Health impacts of air pollution exposure from 1990 to 2019 in 43 European countries. Scientific Reports. 2021; 11(1): 22516.
26. Lelieveld J, Pozzer A, Pöschl U, et al. Loss of life expectancy from air pollution compared to other risk factors: a worldwide perspective. Cardiovascular research. 2020; 116(11): 1910-7.
27. Amuka JI, Asogwa FO, Ugwuanyi RO, et al. Climate change and life expectancy in a developing country: evidence from greenhouse gas (CO2) emission in Nigeria. International Journal of Economics and Financial Issues. 2018; 8(4): 113.
28. Obrizan M, Wehby GL. Health expenditures and global inequalities in longevity. World Development. 2018; 101: 28-36.
29. Raghupathi V, Raghupathi W. The influence of education on health: an empirical assessment of OECD countries for the period 1995–2015. Archives of Public Health. 2020; 78(1): 1-18.
30. Luy M, Zannella M, Wegner-Siegmundt C, Minagawa Y, Lutz W, et al. The impact of increasing education levels on rising life expectancy: a decomposition analysis for Italy, Denmark, and the USA. Genus. 2019; 75: 1-21.
31. Chandran A, Kahn G, Sousa T, Pechansky F, Bishai DM, et al. Impact of road traffic deaths on expected years of life lost and reduction in life expectancy in Brazil. Demography. 2013; 50(1): 229-36.
32. James SL, Lucchesi LR, Bisignano C, Castle CD, Dingels ZV, Fox JT, Hamilton EB, Liu Z, McCracken D, Nixon MR, Sylte DO. Morbidity and mortality from road injuries: results from the Global Burden of Disease Study 2017. Injury prevention. 2020; 26(Suppl 2): i46-56.
33. Eun SJ. Trends in mortality from road traffic injuries in South Korea, 1983–2017: Joinpoint regression and age-period-cohort analyses. Accident Analysis & Prevention. 2020; 134: 105325.
34. Fei FR, Zhong JM, Yu M, Gong WW, Wang M, et al. Impact of injury-related mortality on life expectancy in Zhejiang, China based on death and population surveillance data. BMC public health. 2018; 18(1): 1-7.
35. Lozano R, Fullman N, Mumford JE, Knight M, Barthelemy CM, et al. Measuring universal health coverage based on an index of effective coverage of health services in 204 countries and territories, 1990–2019: a systematic analysis for the Global Burden of Disease Study 2019. The Lancet. 2020; 396(10258): 1250-84.
36. Davis K, Huang AT. Learning from Taiwan: experience with universal health insurance. Annals of internal medicine. 2008; 148(4): 313-4.
37. Ranabhat CL, Atkinson J, Park MB, Kim CB, Jakovljevic M. The influence of universal health coverage on life expectancy at birth (LEAB) and healthy life expectancy (HALE): a multi-country cross-sectional study. Frontiers in pharmacology. 2018; 9: 960.
Review: Research |
Subject:
Public Health
Received: 2023/02/21 | Accepted: 2023/05/15 | Published: 2023/11/28
Received: 2023/02/21 | Accepted: 2023/05/15 | Published: 2023/11/28
Send email to the article author
| Rights and permissions | |
 |
This work is licensed under a Creative Commons Attribution 4.0 International License. |